

Moving averages are some of the most popular indicators in the world, being used by institutions and retail traders to find an edge in the markets. Whether you’re trading bitcoin, forex or even equities, there is always a place in technical analysis for the 200 EMA.
The issue being that just blindly following a moving average, or even looking for a break of a moving average just isn’t enough to profitably trade the markets. So, in this article we are going to look at the 200 EMA and how you can use this in your trading to give you an advantage.
What Is The 200 EMA?

The 200 EMA is one of the most common forex trading indicators used by traders around the world. The EMA or moving average is fairly simple to calculate and this is why it’s favoured as one of the best indicators. The logic behind the indicator is very clear and unlike some of the other indicators, the outcome of the 200 EMA is very clear to see.
The moving average is calculated by looking at a range of prices over the last few days, then finding the average. This could look something like this:
Over a 3 day period, GBPUSD traded at 1.08, 1.12 and 1.19. To calculate the moving average, we would need to add all of the results together, then divide that number by the number of days. In this case, the 3 day moving average would be 1.13.
To get the 200 EMA, we do that exact process again but over 200 days. Allowing 200 days gives us more of an overview of the pairs direction as a whole, rather than any kind of short term price movements.
How To Use The 200 EMA In Your Trading
There are many misconceptions about using EMA’s that lead to traders taking losses. The most common is that the EMA is a tool for finding precise entries. The reality couldn’t be more different. The 200 EMA is a long term indicator. This means it is useful for highlighting long term trends in the market, rather than short term moves.
In principal:
- If price is trading above the 200 EMA, you’ll be looking for long trades.
- If price is trading below the 200 EMA, you’ll be looking for short trades.
This is in no way bulletproof but it can certainly help to avoid getting caught on the wrong side of a trending market.
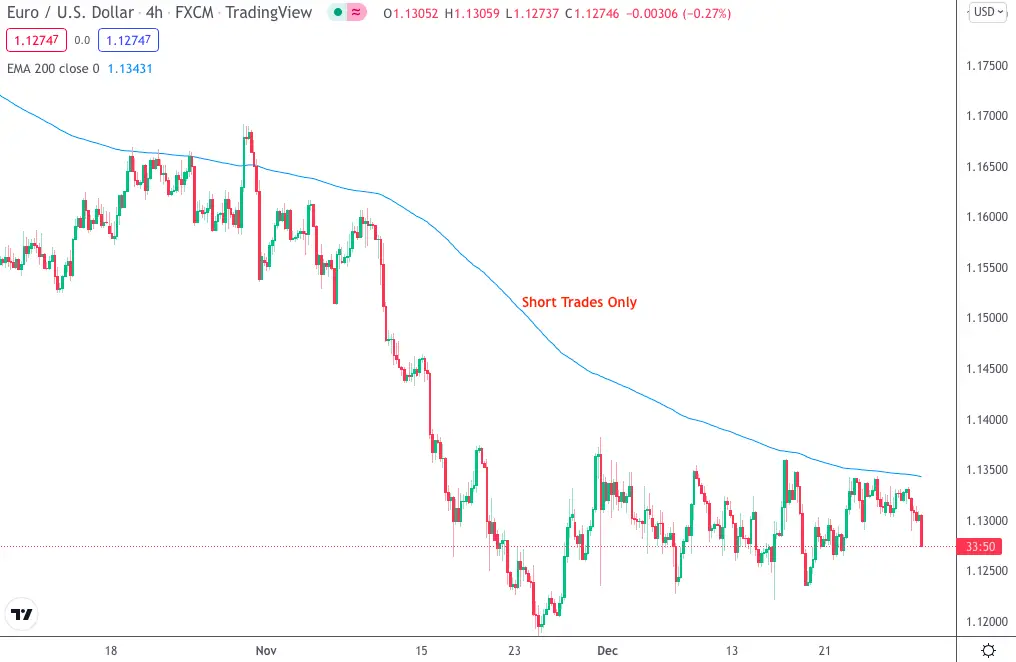
As you can see in this example, looking for short trades on EURUSD 4H as price was trading below the 200 EMA would have given you an edge in the market.
Using The 200 EMA To Enter Forex Trades
There are multiple ways to use the 200 EMA in your forex trading strategies. Let’s take a look at the 3 ways I personally use in my trading…
1. Using The 200 EMA As A Directional Bias
One way to use the 200 EMA in your forex trading is to use it as a directional bias. This is as simple as it sounds and forms the bedrock of a lot of traders bias!

On USDJPY daily chart, we can see a bullish trend. The trend is confirmed by the fact the price is above the 200 EMA. We can assume that the price is going to continue to the upside, until the 200 EMA is broken. This is our directional bias. If we were trending below the 200 EMA, we would be looking for selling opportunities instead.
2. Using The 200 EMA With Support And Resistance
My favourite way, and the most common way to trade the 200 EMA in forex markets is to combine it with another form of price action confluence. This is most commonly some type of support and resistance. Having the multiple trading confluences can make for high quality opportunities with great risk to reward ratios…

In this chart, we can see the USDCAD on the 4H time frame. Price was below the 200 EMA, then moved up in a large bullish move and started to retest above the EMA. As shown, price came to a key support level, with the bullish 200 EMA confluence as well. Taking a long trade here was very smart and even just using a H4 bullish engulfing candle for an entry, would have resulted in a huge risk to reward trade.

On AUDCHF here on the daily chart, we can see that price moved below the 200 EMA (indicating a sell), then rejected a resistance. This resistance also formed a head and shoulders formation, making another trading opportunity for price action traders. With your stop loss just above the 200 EMA, the risk to reward on this trade would have been huge.
3. Trading Bounces Off The 200 EMA
One of the most common ways to trade using the 200 EMA is to actually trade rejections from the EMA. The 200 EMA can be so powerful that sometimes price will just fall away from that average and reject price in that area. This provides some great trading opportunities…

On AUDUSD on the Daily time frame, price has rejected the 200 EMA and moved aggressively to the downside. The 200 EMA is not consistent enough with reactions to just trade purely at the touch of the EMA, we would need to find another few confluences to actually enter a trade.

If we drop to the 1 hour chart, which in this case is a lower time frame, we can see a clear entry into the trade. Price rejected, then broke a key support/resistance level, followed by breaking through a very prominent trend line. Now this isn’t bulletproof by any means and there is still a chance this trade would reverse through the 200 EMA and lose, however, with correct risk management this is a potential trading opportunity.
Does The 200 EMA Work On All Time Frames?
Price action traders typically like to use multi time frame analysis when finding trading opportunities. The 200 EMA does work on all time frames, ranging from 1 Minute charts all the way to Weekly charts. However, the actual effectiveness is going to great vary.

The chart above is showing EURUSD on the 1 Minute time frame. As you can see, the price is trading around the 200 EMA and constantly breaking below or above. This could still potentially be useful for some traders but in my opinion it is much too complicated and the bias changes too often. This is just part of trading the lower time frames however, indicators and price action strategies are much less effective than they would be on the higher time frames.

In this chart you can see the USDCAD on the 4 hour time frame. The 200 EMA is much clearer and you can easily identify at least 2 very solid buying opportunities based on this simple logic.
The higher you go in time frames, the longer (in terms of time), the data is, meaning we get a much smoother EMA and a much more useful EMA. With that being said, the EMA still technically works on all timeframes, I just wouldn’t recommend anything lower than the 1H chart.
In Summary – How To Use The 200 EMA In Forex Trading?
In conclusion, the 200 EMA is a great tool for forex traders to give us a directional bias. It’s very hard to gauge the trend of a currency pair by eye, so having an EMA to show you to the trending direction is extremely useful.
In short, if price is above the 200 EMA, it may be wise to look for long trading opportunities. If price is below the 200 EMA, it may be wise to look for short trading opportunities.
This is exactly the kind of strategy that could easily be turned into a forex trading bot, with the right knowledge – food for thought!
If you’re hesitant about creating a trading bot, use ChatGPT to create a trading script, which will highlight entry opportunities for you to manually trade and test the system!
If you have any experience trading with the 200 EMA, or any tips for traders then please leave them in the comments below – I’d be curious to hear how you use the indicator!